Back
Quantitative KPI
We help our clients to build a monitoring system with regard to the data the monitoring of which is directly related to the expected result achievement. We define and prioritize KPI, and form the monitoring system. Graphic visualization helps to see the prioritization of objectives and their implementation progress.
CLM-system simultaneously registers dozens of different data:
Location
Slideshow duration
Number of showed
slides
slides
Number of conversions by presentation branches
Start time of the demonstration
Dozens of other values
KPI visualization sample for pharmaceutical
company‘s sales team
company‘s sales team
After achieving the goal of the current level, next task appears— from the bottom to the top. Blue color of the set means the achievement of an objective.
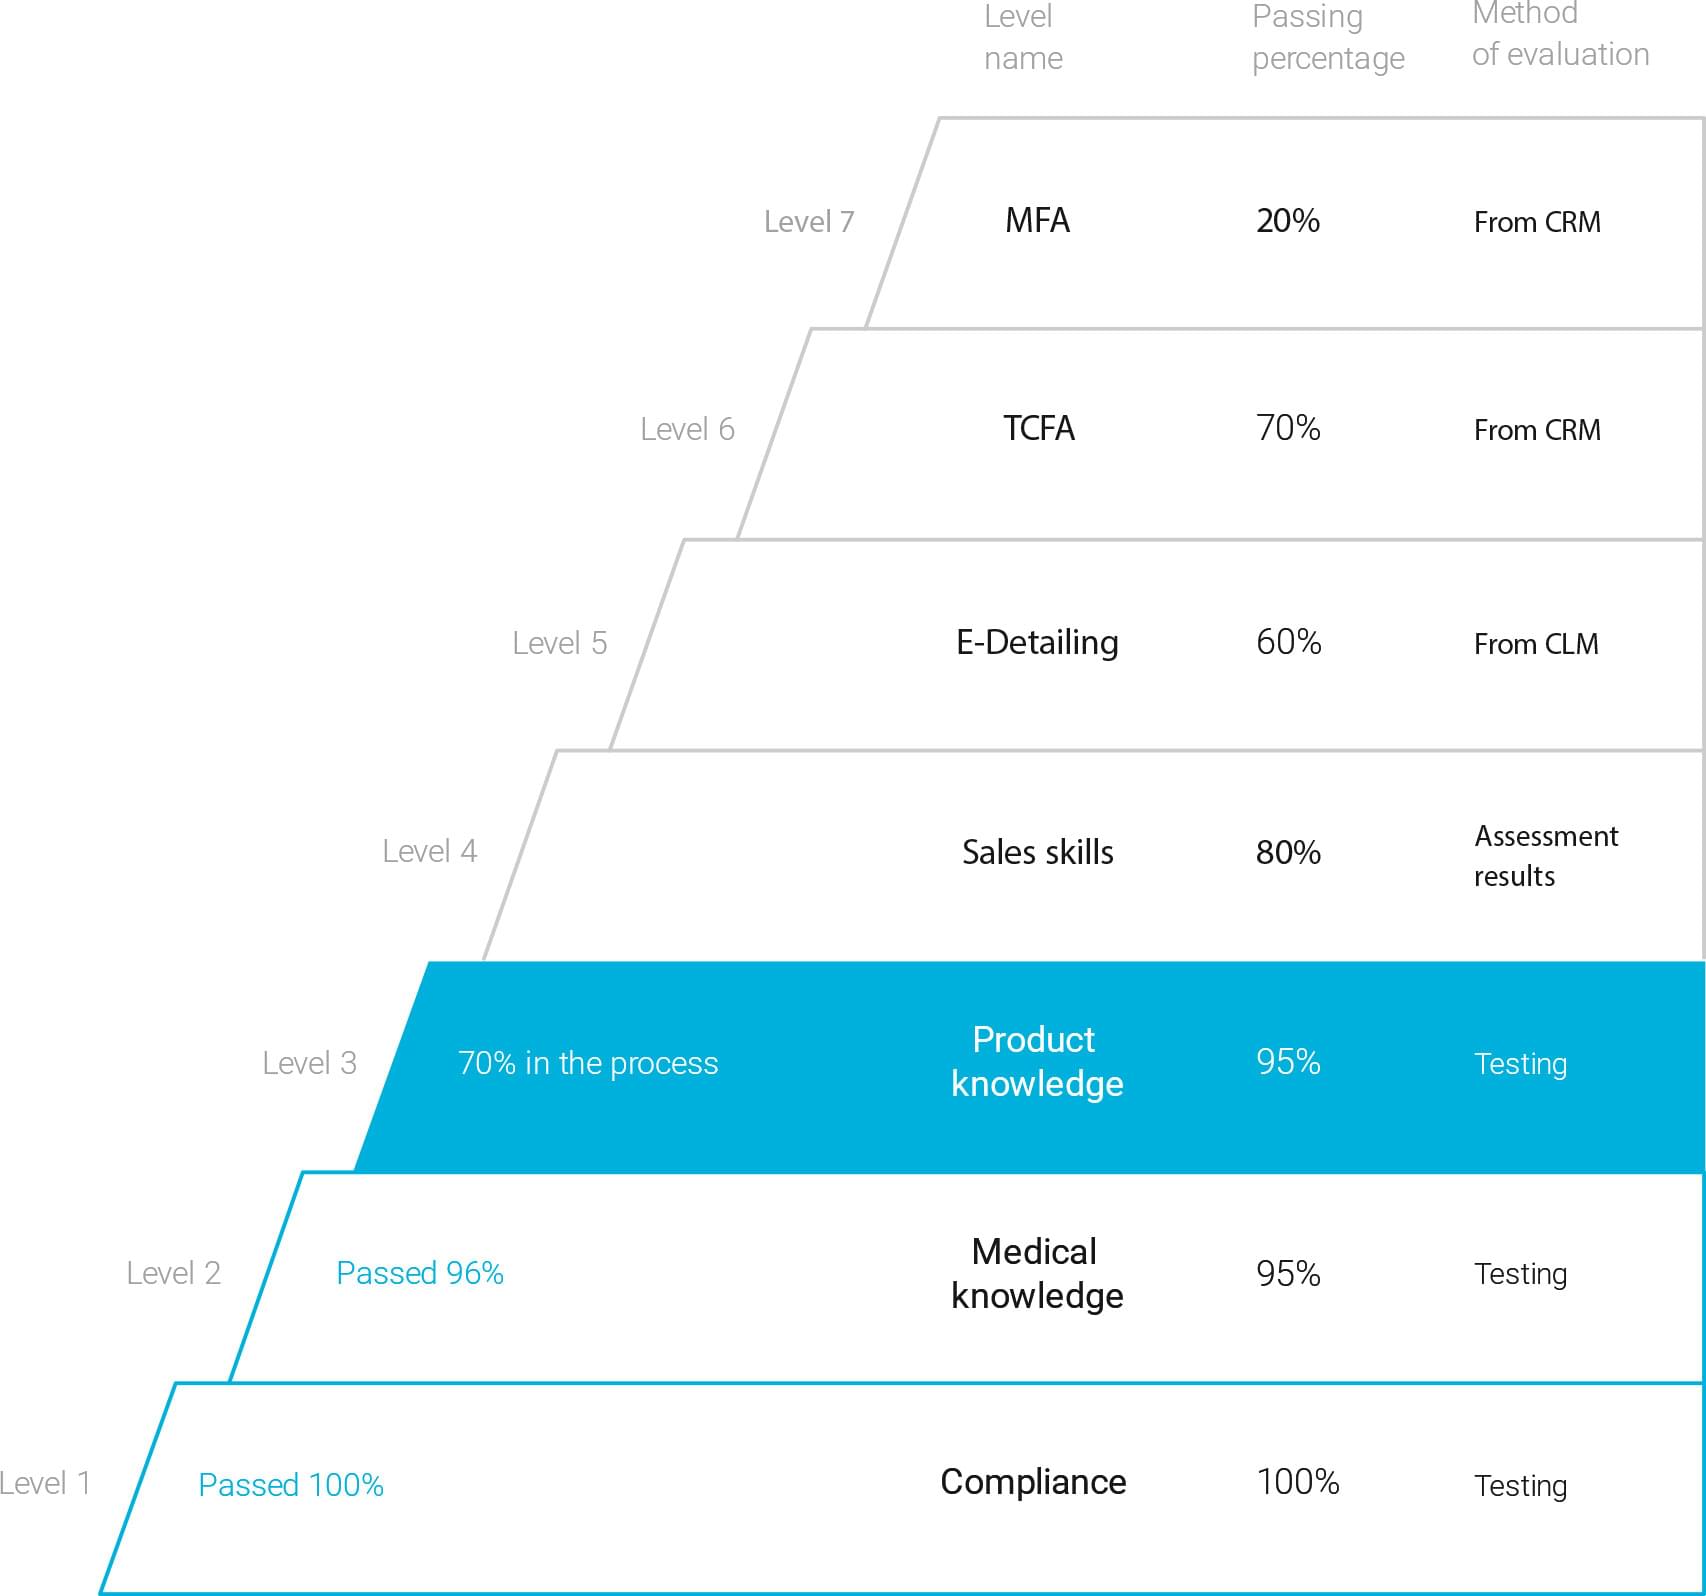
| Level name | Passing percentage | Method of evaluation |
Level 7
| MFA | 20% | CRM |
Level 6
| TCFA | 70% | CRM |
Level 5
| E-Detailing | 60% | CLM targets |
Level 4
| Sales skills | 80% | Assessment results |
Level 3
70% in the process
| Product knowledge | 95% | Testing |
Level 2
Passed 96%
| Medical knowledge | 95% | Testing |
Level 1
Passed 100%
| Compliance | 100% | Testing |